The Key Performance Indicator (KPI) Widget provides a quick, visual summary of your workflow performance right on your dashboard. It aggregates key metrics from your workflow records, offering instant insight into totals, averages, and counts in a visually appealing format.
Steps to Add a KPI Widge
1. Open Dashboard
Navigate to the dashboard where you want to add the widget.
2. Click “Add Widget”
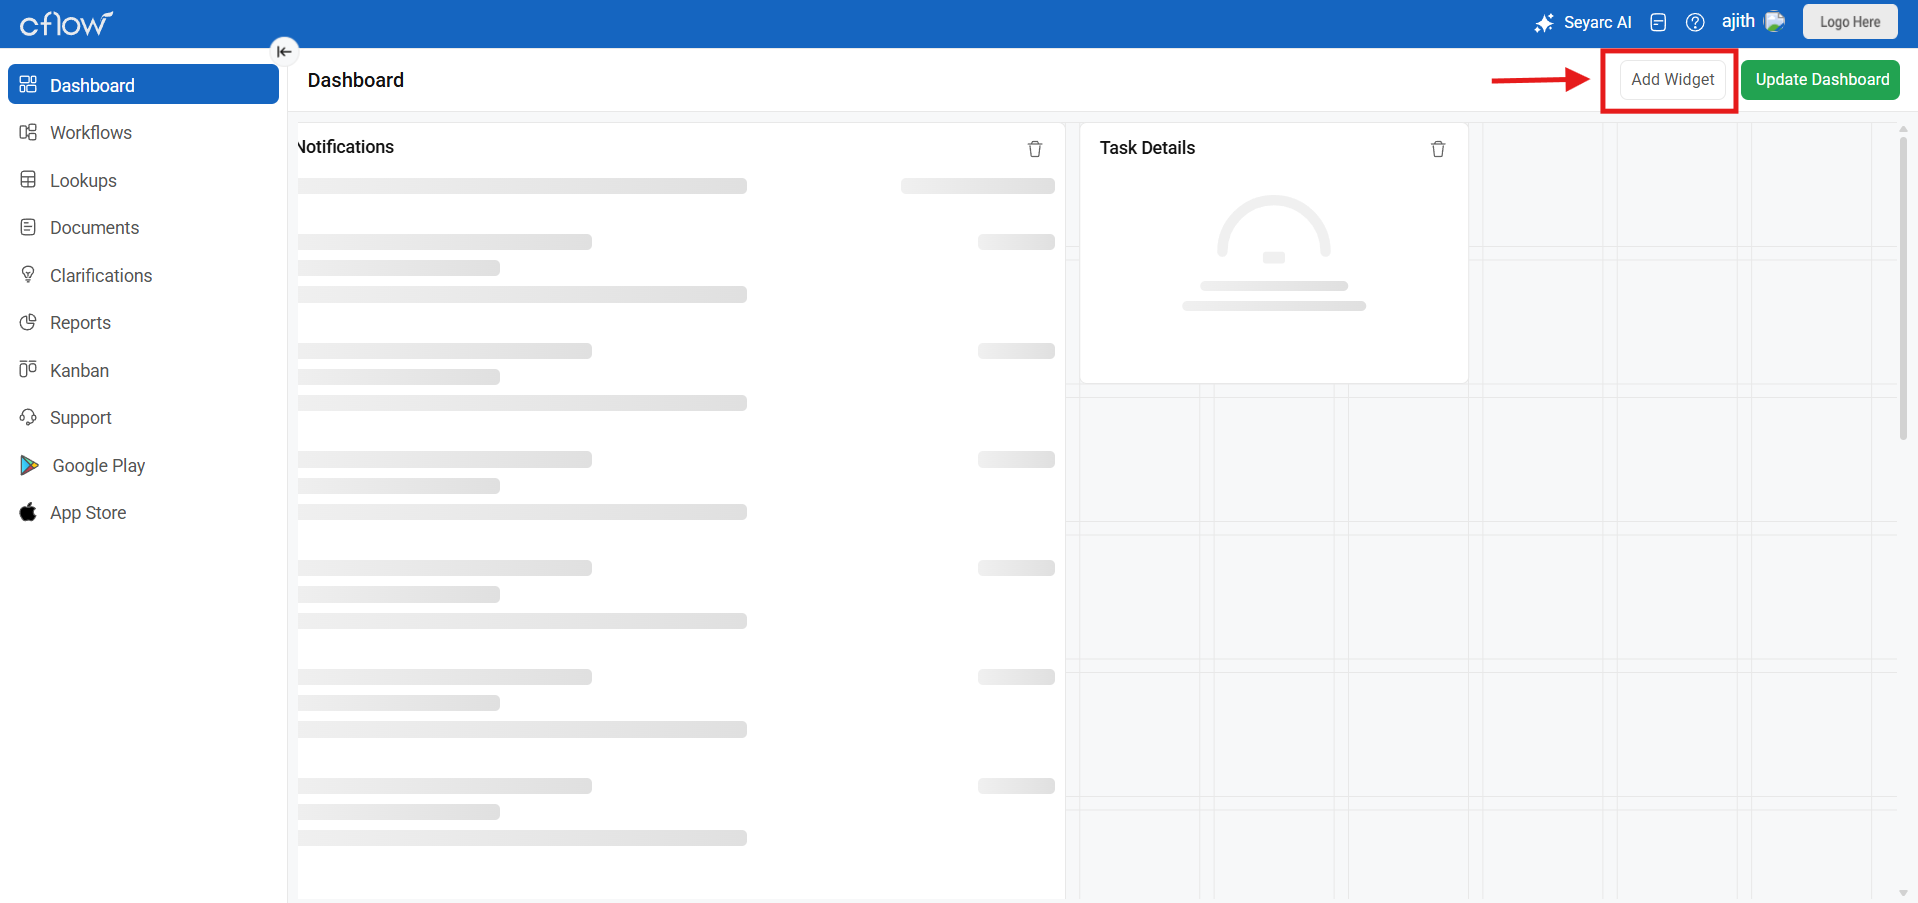
Locate and click the Add Widget button.
3. Select Widget Type
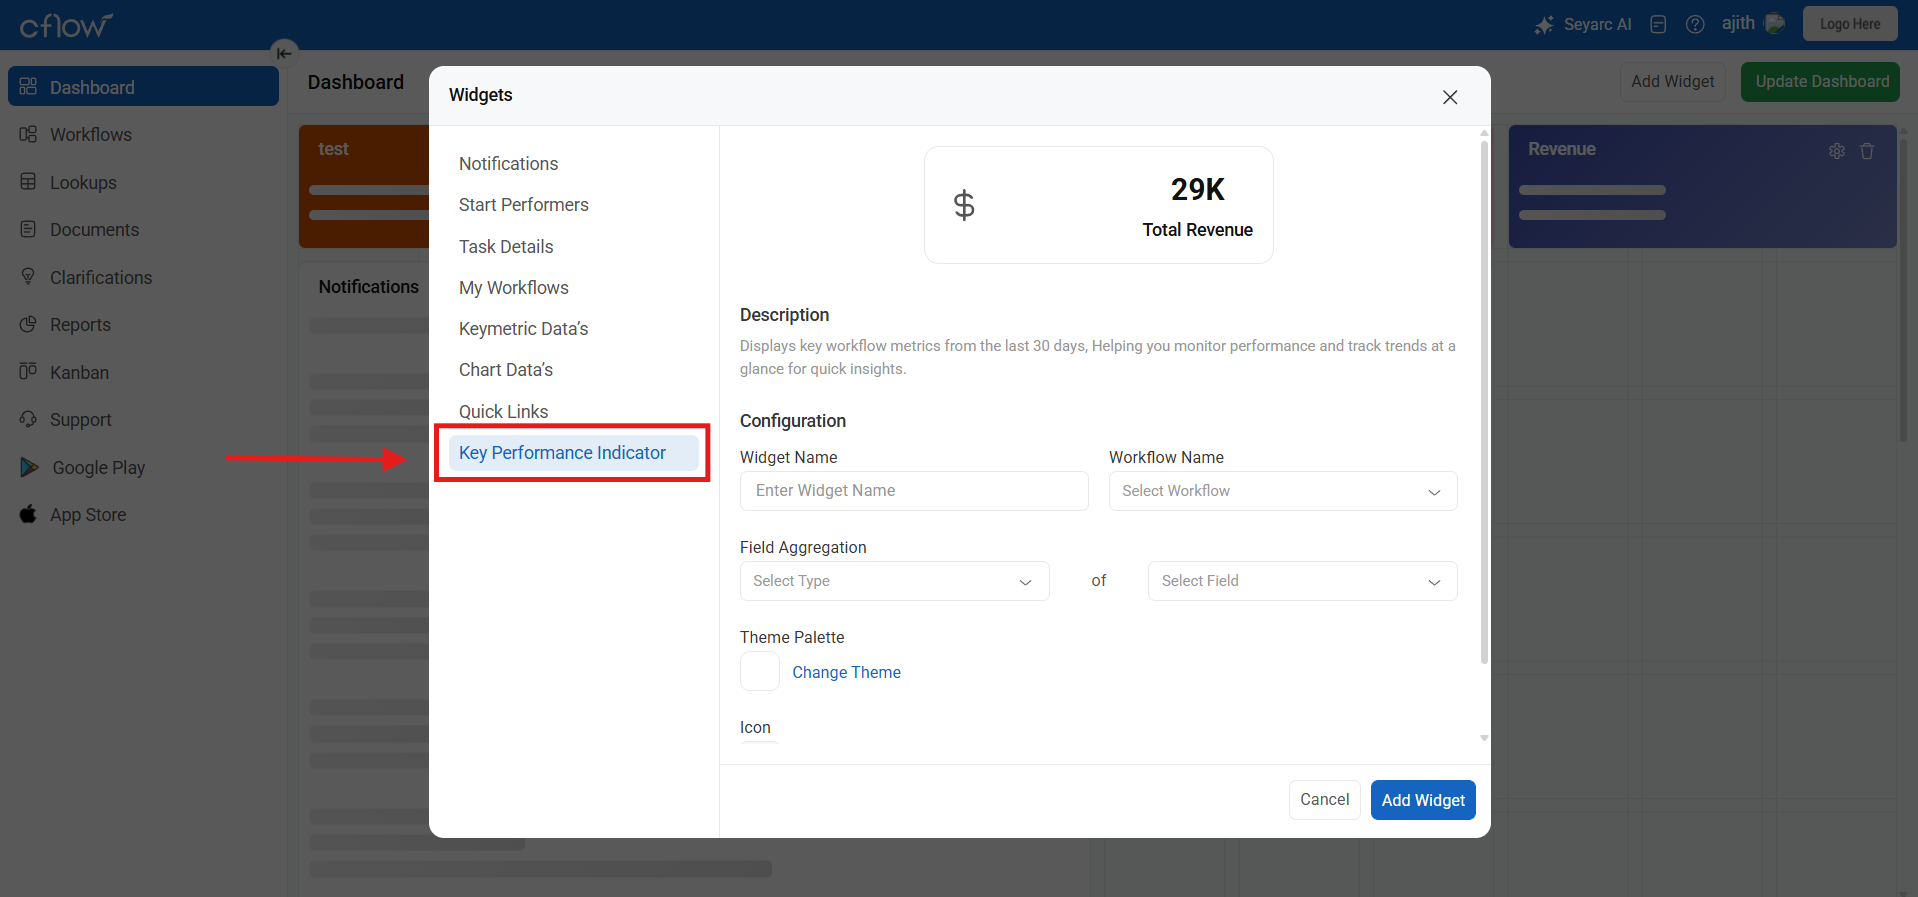
Choose Key Performance Indicator (KPI) from the list of available widgets.
4. Select Workflow
Choose the specific workflow whose data you want to analyze.
5. Select Workflow Field
Pick the field you want to aggregate. The field dropdown will only show supported fields (String, Integer, Decimal, Currency).
6. Select Aggregation Function
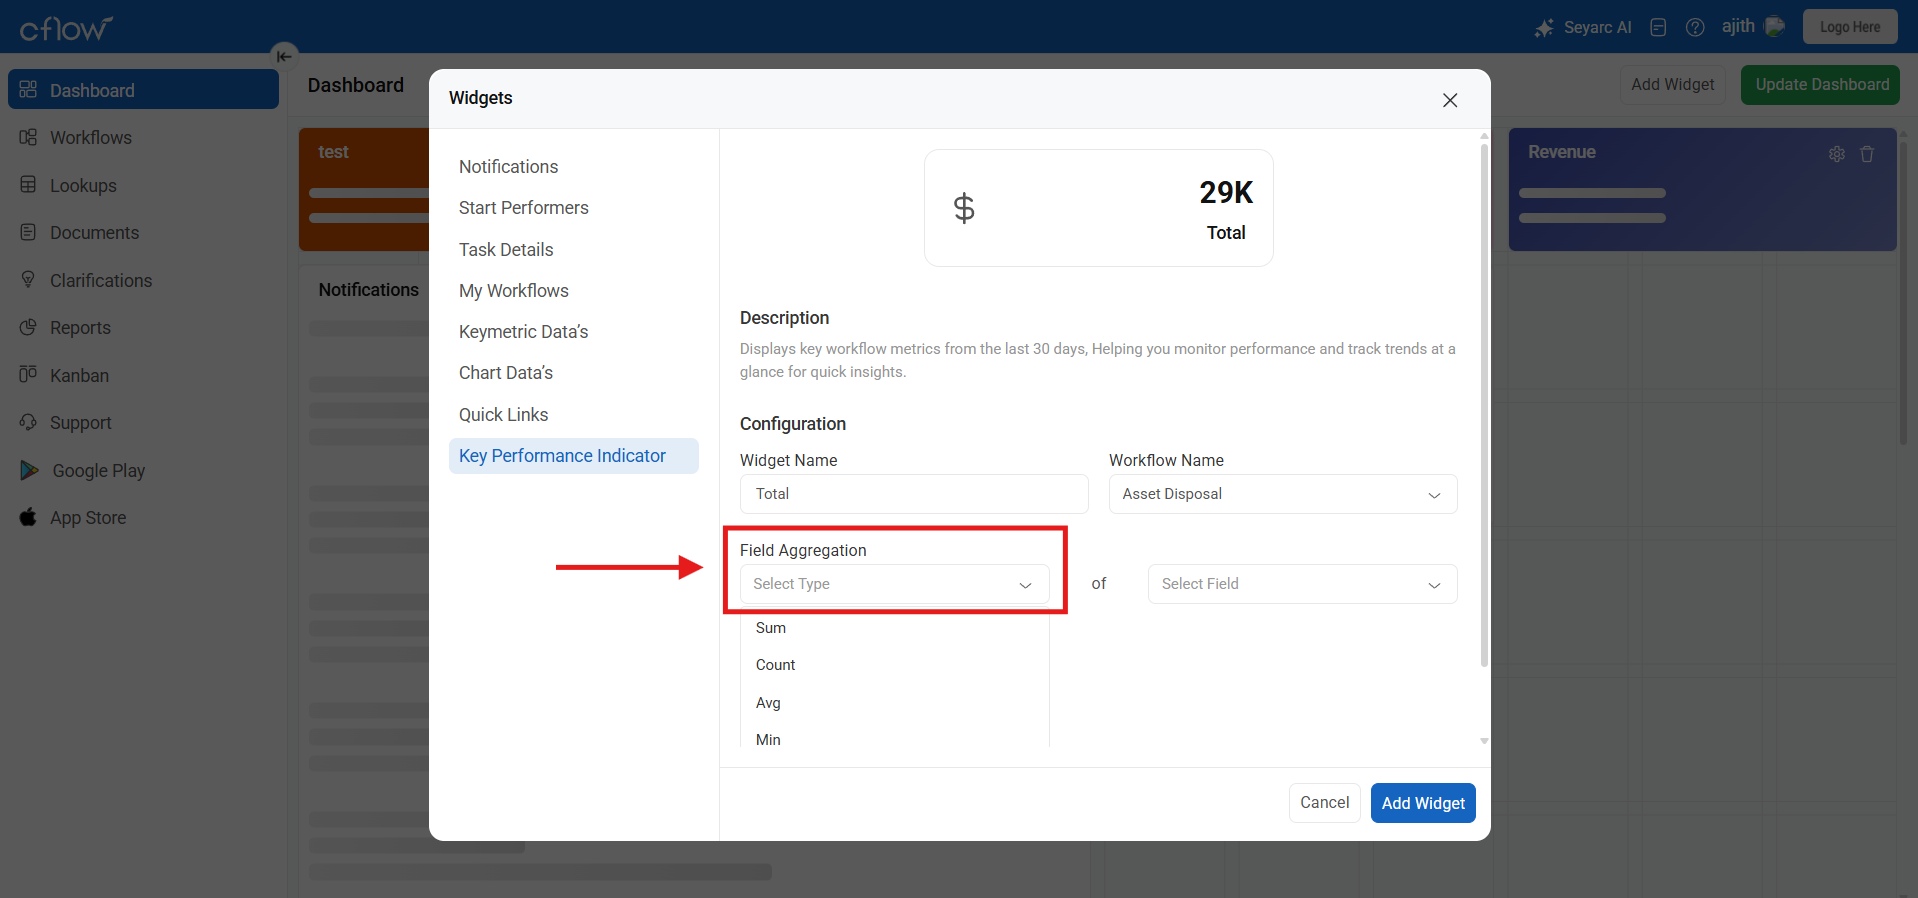
- Choose Count for String or Numeric fields
- Choose Sum, Avg, Min, or Max only for Numeric fields
7. Select Theme
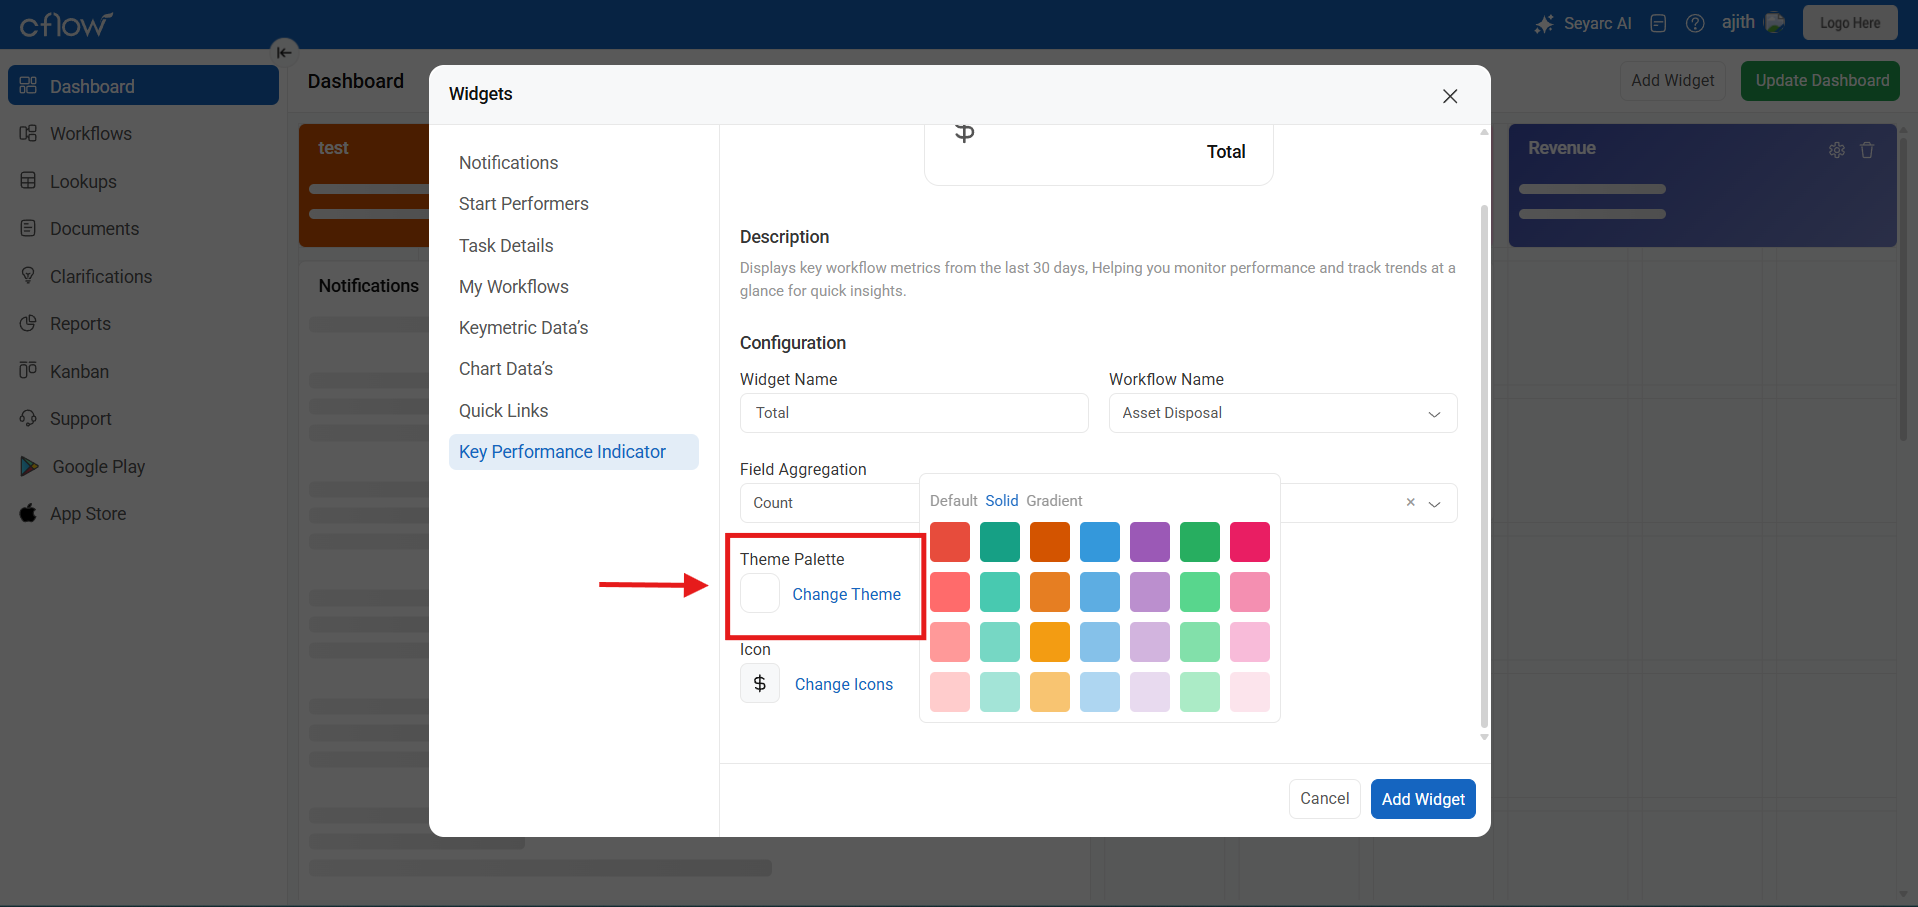
Choose a visual theme from the predefined palettes:
- Default app theme
- Single color
- Gradient
8. Optionally Assign Icon
![]()
Select an icon from the available set to display alongside the value. This step is optional.
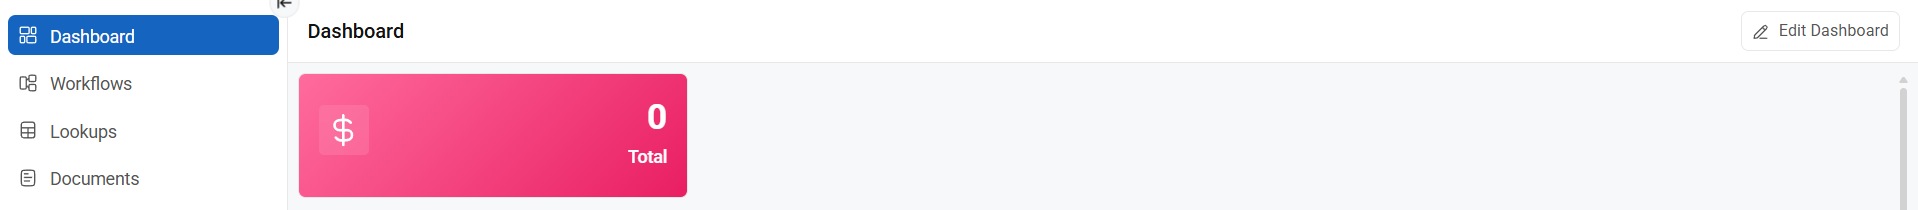
9. Click “Add Widget”
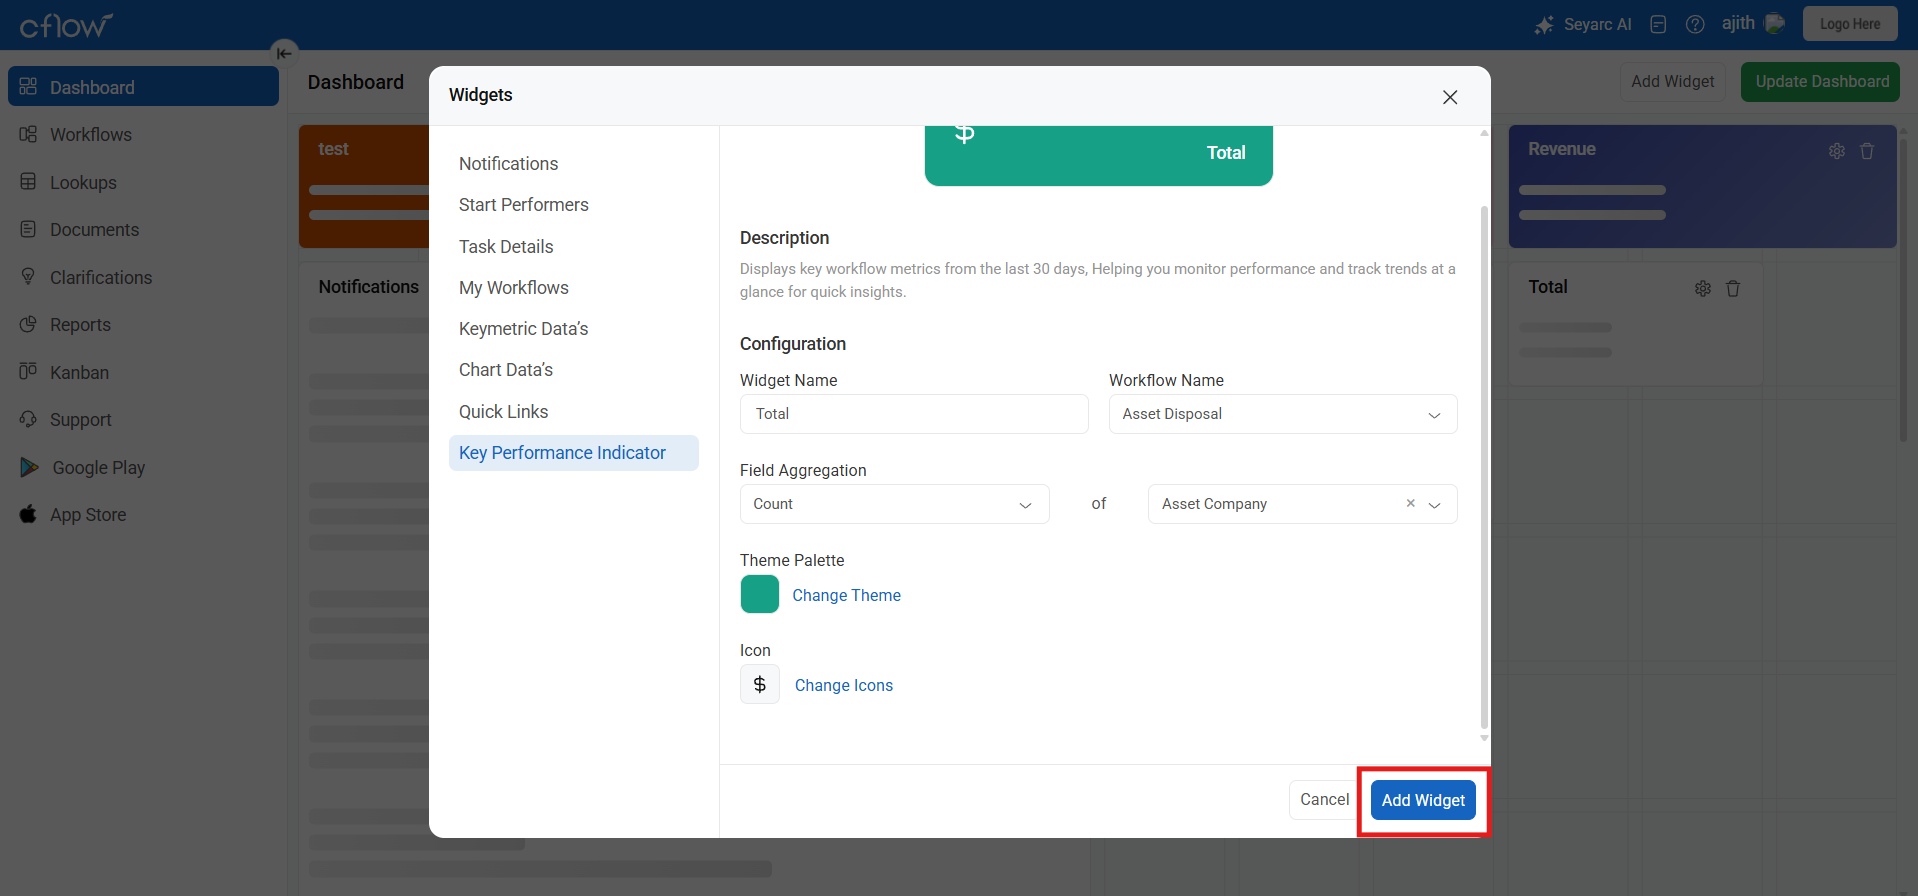
The widget configuration will be saved, and the KPI widget will immediately render on the dashboard, displaying the calculated value.
Note: The widget will display real-time aggregated data from your selected workflow field based on the aggregation function you choose.
📊 Overview
The KPI Widget displays key performance indicators based on your workflow data, helping you monitor important metrics at a glance.
❓ Frequently Asked Questions
Q1. How is the KPI value calculated?
KPI values are calculated based on workflow records created or updated within the last 30 days.
Q2. Can I change the data period (e.g., last 3 months or 1 year)?
Not in this version. The KPI widget always uses a fixed 30-day data window.
Q3. Which fields are supported?
Only the following field types are supported:
- String
- Integer
- Decimal
- Currency
Q4. What aggregation functions can I use?
- Count – Available for all supported fields (including String)
- Sum, Avg, Min, Max – Available only for numeric fields (Integer, Decimal, Currency)
Q5. Can I use my own colors?
No. You can only select from the predefined color palettes provided in the application.
Q6. Is the icon mandatory?
No. The icon is optional and can be added or left blank.
Q7. How often does the data refresh?
The KPI recalculates whenever the dashboard is reloaded or workflow data is updated.
Q8. Can I create multiple KPI widgets for one workflow?
Yes, you can add multiple KPI widgets for different fields and aggregations within the same workflow.
Q9. Are complex fields like tables or multi-select supported?
No. Only simple data fields are supported in the KPI widget.