1. Go to Dashboard and click Edit Dashboard.
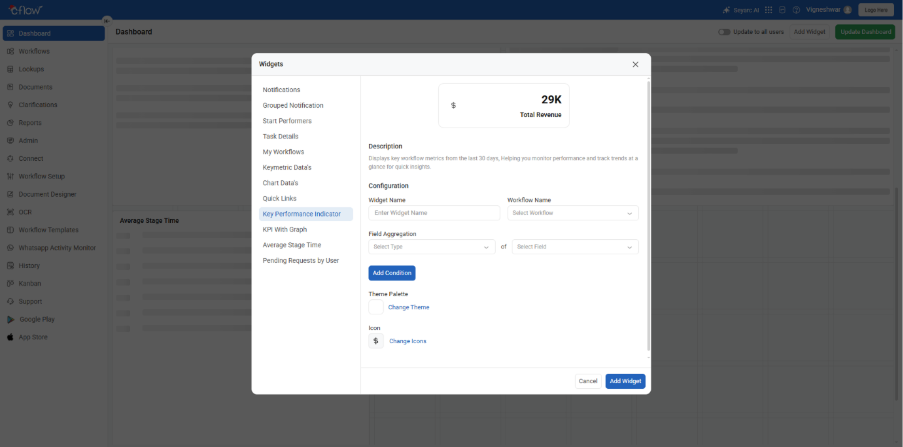
2. Click Add Widget to open the widget selection popup.
3. Select Key Performance Indicator.
4. In the Configure section:
– Enter a Widget Name that clearly describes the metric.
– Select the Workflow Name from the dropdown.
– Choose the appropriate Field Aggregation (for example: count, sum, average).
5. Click Add Condition to define filtering rules.
6. In the Rule Condition popup:
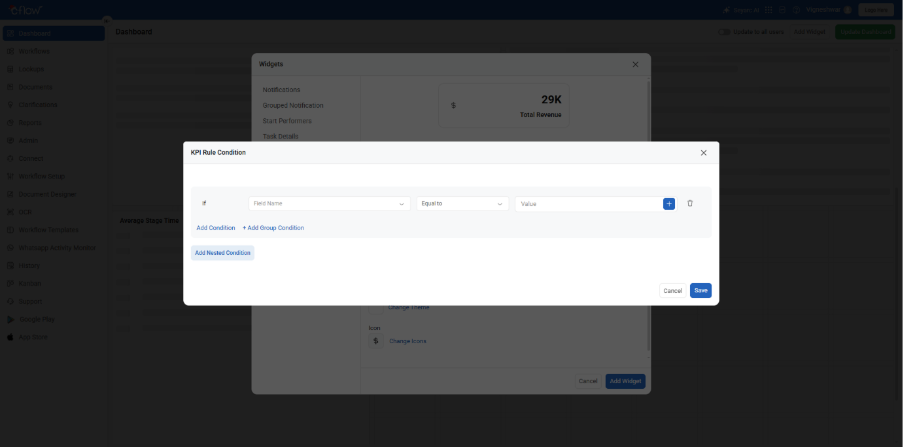
– Select the field
– Choose the condition operator
– Enter the required value
– Click Save to apply the condition
7. Click Add Widget.
8. Click Update Dashboard to save your dashboard changes.
After adding the widget:
- The KPI widget displays values based only on the defined conditions.
- You can edit the widget later to modify or add more conditions as needed.
- This helps keep KPIs focused and relevant.
FAQs
1. What is a KPI widget?
A KPI (Key Performance Indicator) widget displays important metrics such as counts, totals, or averages related to a workflow.
2. Why should I add conditions to a KPI widget?
Conditions help filter workflow data so that the KPI reflects only specific scenarios, such as a particular status, stage, or field value.
3. How do I add conditions to a KPI widget?
While configuring the KPI widget, click Add Condition, define the rule in the Rule Condition popup, save it, and then add the widget.
4. Can I add more than one condition?
Yes. You can add multiple conditions to refine the KPI data further.
5. Can I edit or remove conditions later?
Yes. You can edit the widget at any time from the dashboard to modify or remove existing conditions.