A table report presents data in a structured grid format using rows and columns. In Cflow, you can create unlimited table reports using any field from your workflow. Follow the steps below to create your own report:
- From the left navigation panel, go to Reports.
- Click on the Table Reports tab.
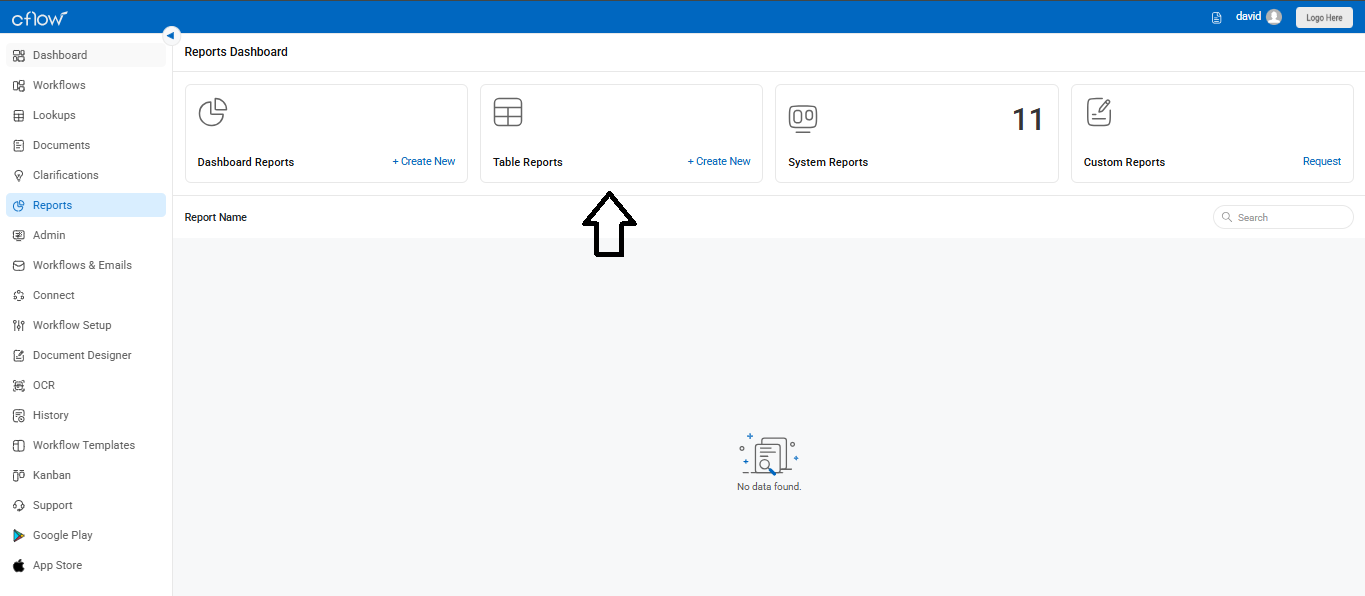
- Then click on Create New to begin creating a new table report.
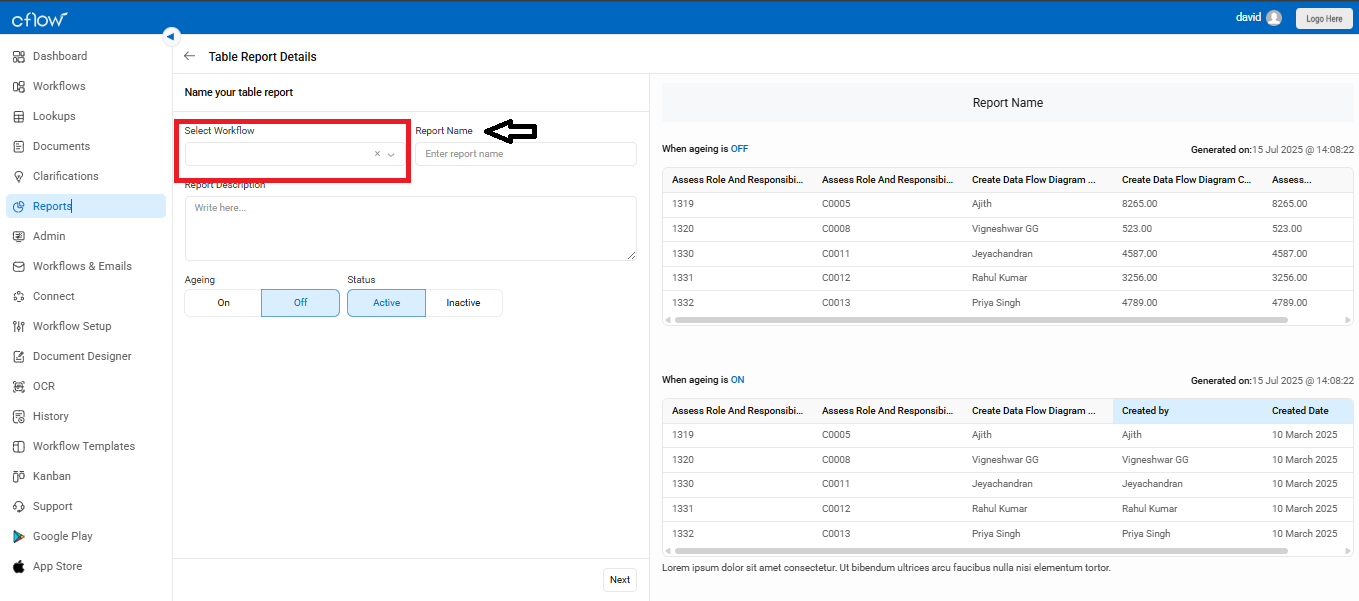
Select Workflow
Under “Select Workflow”, click the dropdown to choose the workflow (e.g., Expense Report) for which you want to create the report.
This determines which form data will populate your report.
Enter Report Name
In the “Report Name” field (next to the black arrow), type a unique name for your report.
Example: “Expense Summary Q3 2025”
This helps in identifying the report easily later in the Reports Dashboard.
Add Description (Optional)
Below the report name, there is a description box where you can add notes or context for the report.
Example: “Shows detailed status of all expense reports submitted in Q3.”
Set Aging Option
- Under “Aging”, you’ll see two button options: On and Off.
Select On to include aging-related data such as:
- Submitted Date
- Submitted By
- Pending With
- Current Status
- Pending Since Initiated
1. Set Report Status
Choose between:
Active – The report will be available for use.
Inactive – The report is saved but not currently in use.
Click the “Next” button at the bottom right to continue to the next configuration screen (e.g., selecting columns, filters, etc.).
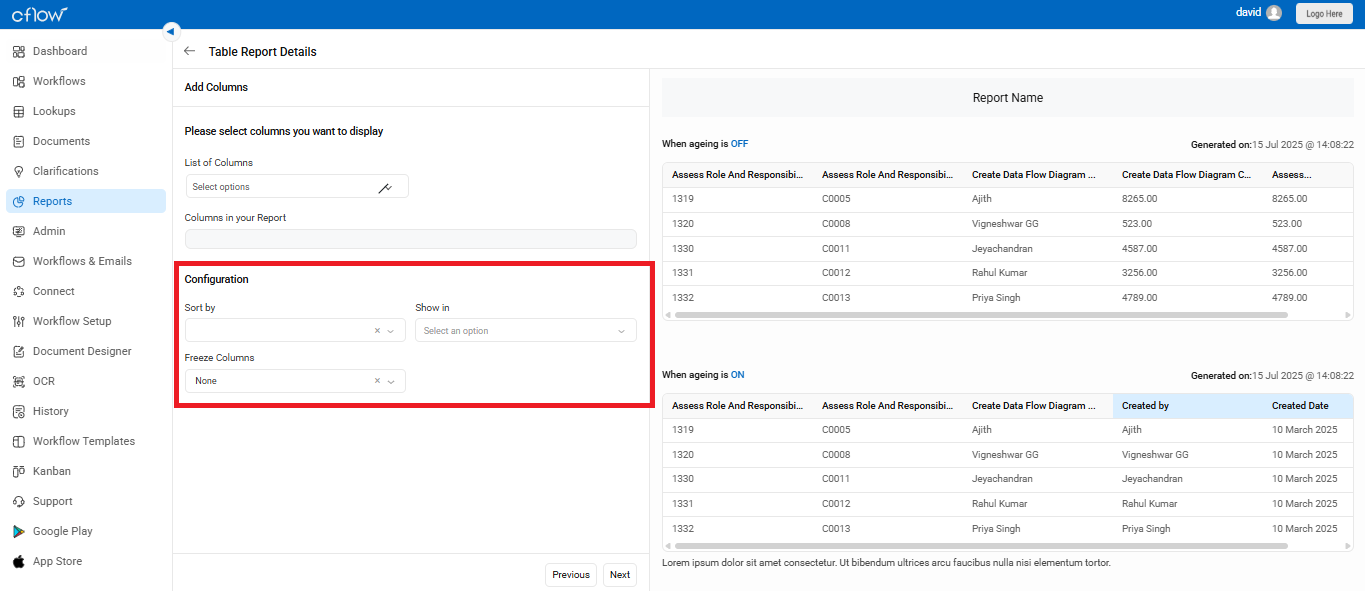
2. Add Columns:
Choose the form fields you want to display as columns using the dropdown under List of Columns.
You can also:
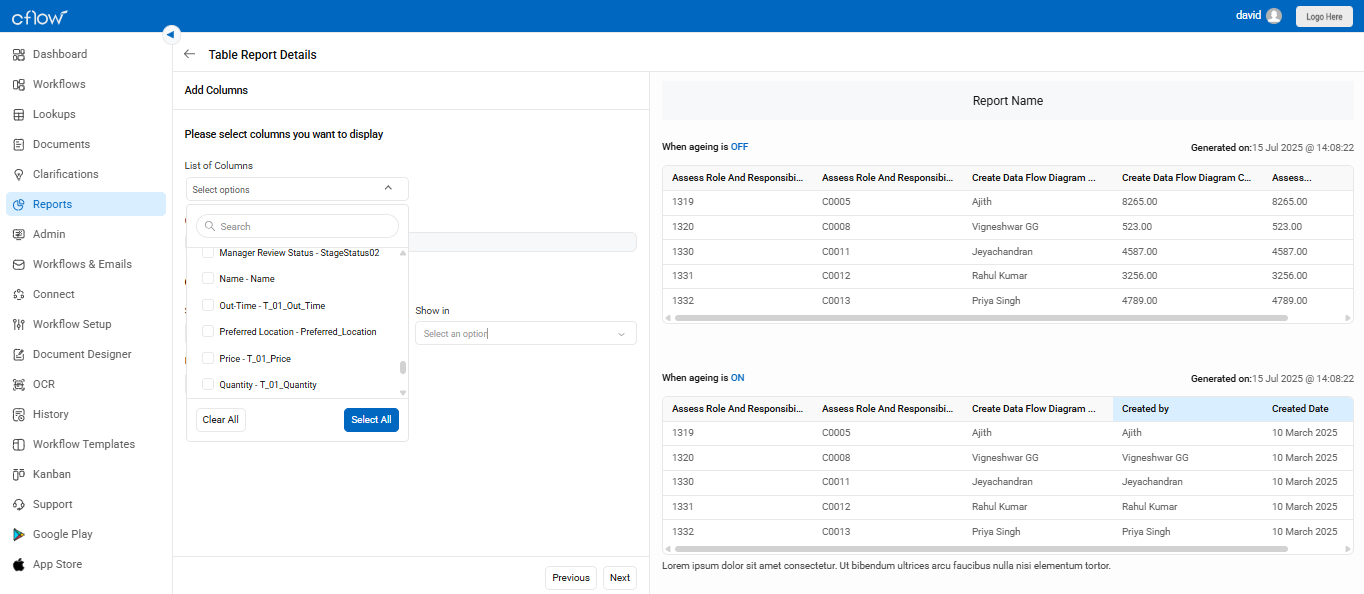
- Sort the report by a selected column.
- Freeze Columns (first 1–3 columns) to keep them fixed during scrolling.
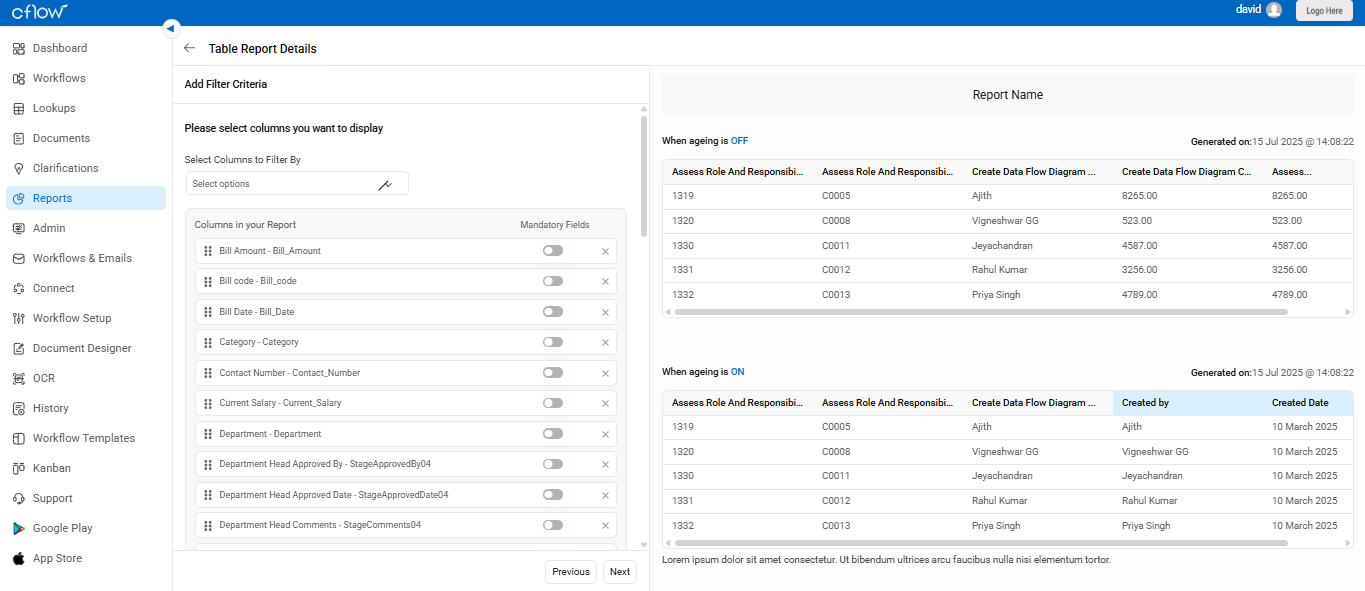
3. Add Filter Criteria:
- Select one or more fields to apply filters on the report.
- This helps narrow down the dataset to match specific criteria.
- You can also choose which fields should be visible or hidden.
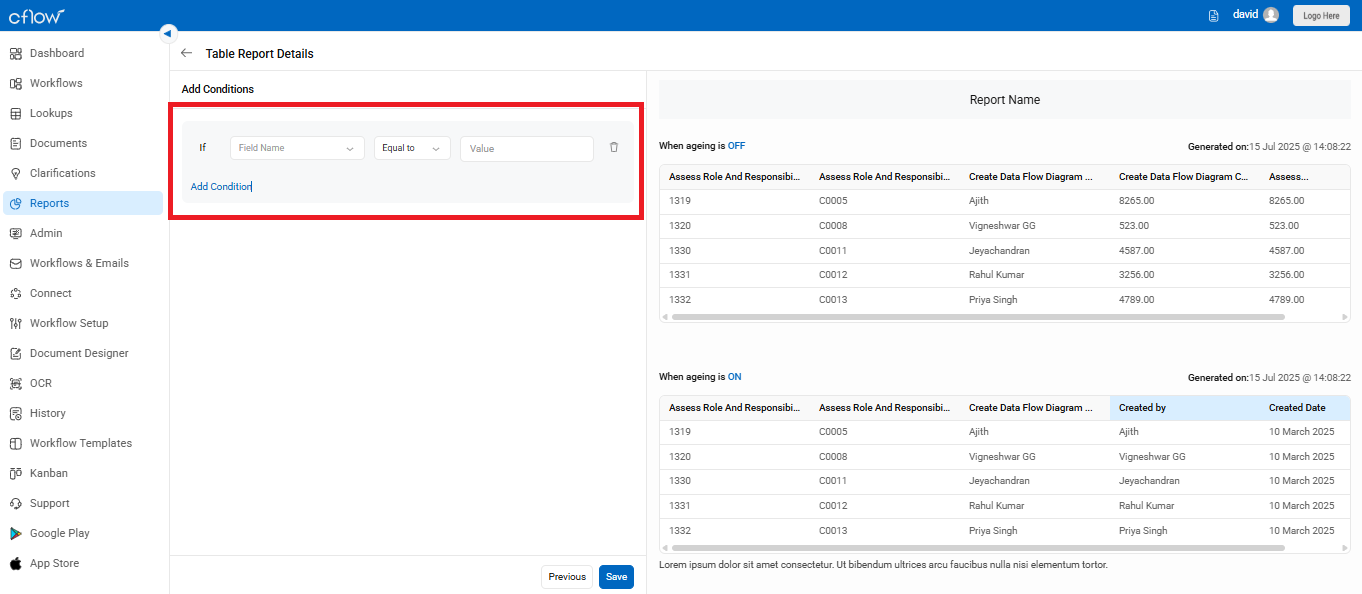
4. Add Conditions
- Add custom conditions to control what data appears in the report output.
- Use operators like Equal To, Not Equal, Greater Than, etc.
- You can apply multiple conditions using AND / OR logic as needed.
After setting all configurations, click Save to generate your report. The preview section on the right displays the report output based on your selections.