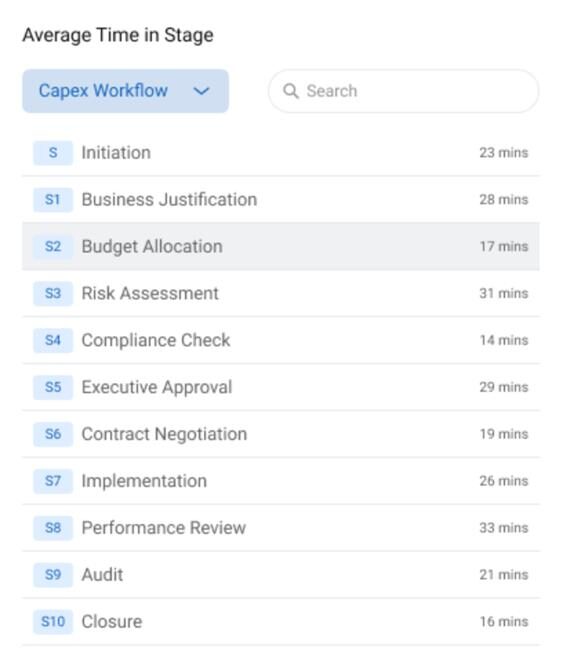
The Average Stage Time widget provides visibility into how long workflow requests spend at each stage. This helps administrators and managers identify delays, optimize processes, and improve overall workflow efficiency.
What this widget shows:
- The average time taken by requests at each stage of a workflow
- Performance trends across one or multiple workflows
- Bottlenecks where requests remain longer than expected
How to add the Average Stage Time widget:
- Navigate to Dashboard from the main menu.
- Click Edit Dashboard to enable dashboard customization.
- Click Add Widget to open the widget selection popup.
- Select Average Stage Time from the list of available widgets.
- Click Configure and choose the workflow(s) you want to analyze.
- Multiple workflows can be selected for comparison.
- Click Add Widget to place the widget on the dashboard.
- Click Update Dashboard to save and apply the changes.
After adding the widget:
- The widget will appear on the dashboard.
- A dropdown inside the widget allows you to switch between the selected workflows.
- The displayed data updates automatically based on the selected workflow.
FAQs
1. What is the Average Stage Time widget?
The Average Stage Time widget shows the average amount of time workflow requests spend in each stage. It helps identify delays and improve workflow efficiency.
2. Can I select multiple workflows in this widget?
Yes. You can select multiple workflows while configuring the widget and switch between them using the dropdown in the widget.
3. Where can I add the Average Stage Time widget?
You can add this widget from Dashboard → Edit Dashboard → Add Widget.
4. Can I change the selected workflow after adding the widget?
Yes. The widget includes a dropdown that allows you to change the workflow without editing the dashboard again.
5. Who can add or edit dashboard widgets?
Only users with dashboard edit permissions can add, configure, or modify widgets.