BAM is an exciting feature available in Cflow to monitor the business activities using a consistent set of metrics to measure the past performance and guide business planning based on data and statistical methods. Gain insight and drive business planning in your processes using BAM. Enhance your business processes and get to know how your processes are performing against the benchmarks you had set.
Select Admin -> Analytics.
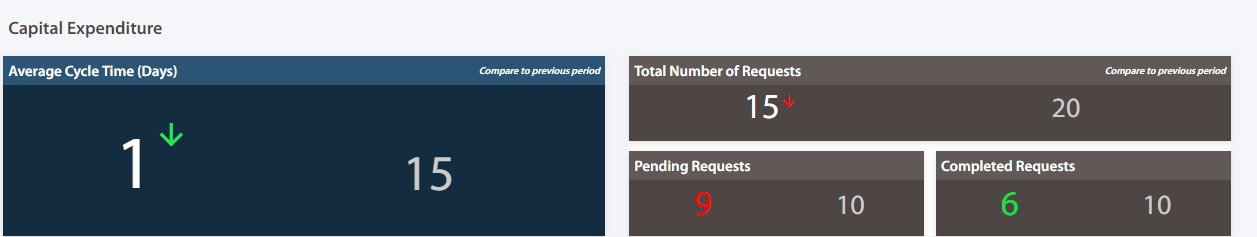
Click on the BAM (Business Activity Monitor). In each workflow you can view the average cycle time based on the period you choose from. Periods available are day, week, month, quarter, year, YTD, custom. You can also compare the analytics with the previous period and gain actionable insights into your processes.

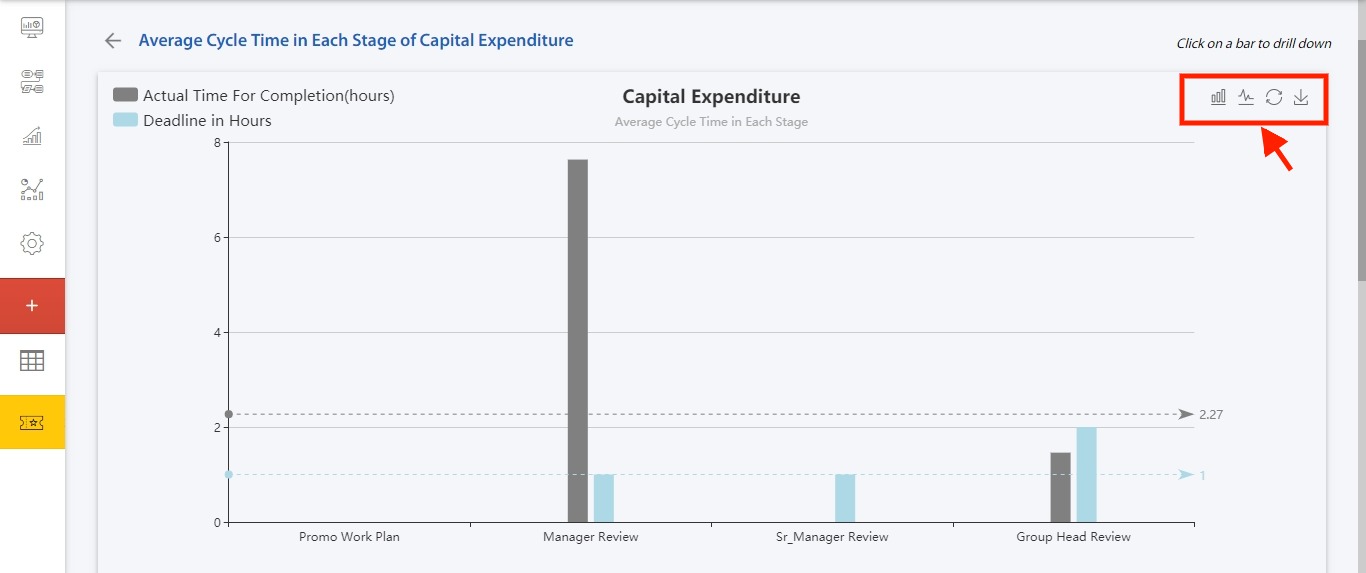
Click on Average Cycle Time (Days) in a workflow to view the analytics as a chart. The average cycle time in each stage of the workflow is represented in the form of bar chart, line chart. The chart shows the Actual Time For Completion with Deadline in hours for each stage. Actual time for completion shows the time taken to approve the request in each process stage. Deadline in hours denotes the deadline mentioned for that stage in the Due In field. Click on the process stage to know the user response time in that stage. Click on save to download this chart.
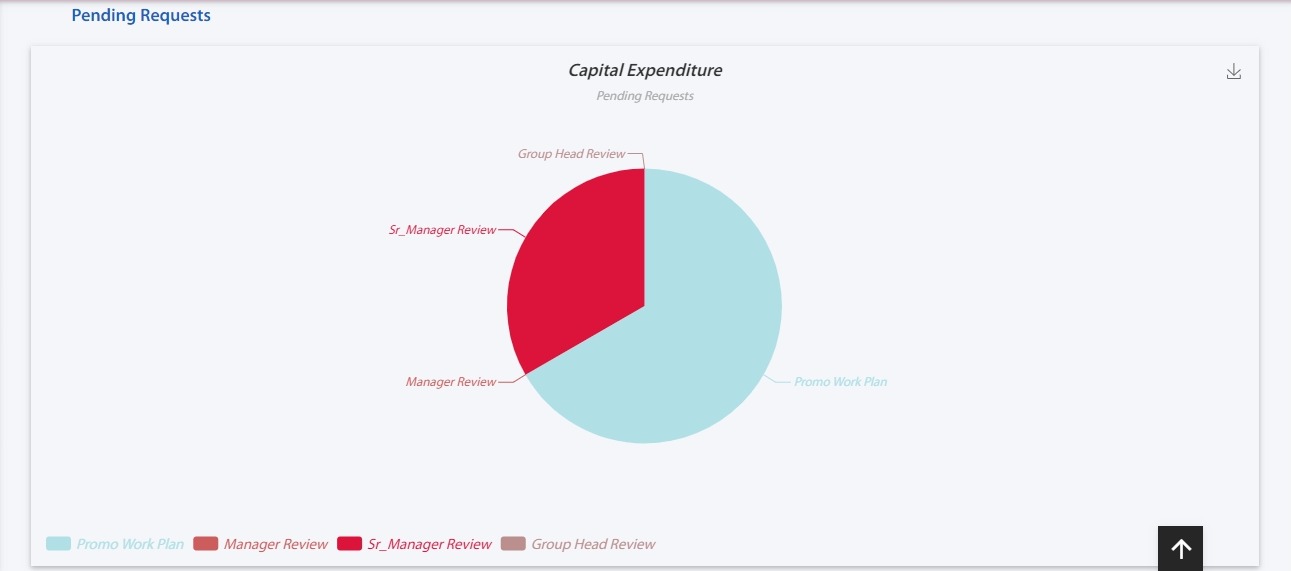
All the pending requests in each stage are represented in the form of pie chart.
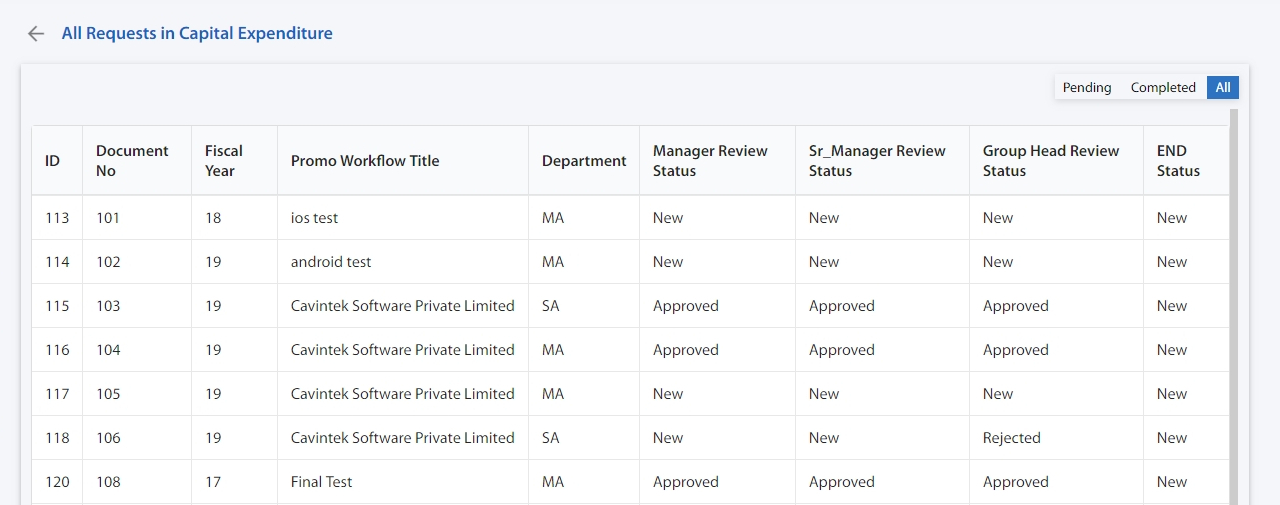
Click on the requests to view the data of pending, completed requests in a workflow.